Lockyer et al. (2013) suggest that learning analytics cannot be properly interpreted unless there is a framework on which to make sense of the data. A potential framework is the design of a learning activity. The authors suggest that there are two main ways that anlytics can be parsed: checkpoint analytics or process analytics.
Checkpoint Analytics
Analytics that can check if students have accessed resources that the learning design considers essential to their learning opportunities. Educators can figure out if students are at least ‘going through the motions’ and starting the learning process. Late starters, or students that do not access resources, can be contacted directly to remind them, or ask if there are problems in starting the learning process.
Process Analytics
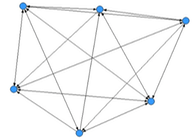
Analytics that tries to ascertain the level or degree that a student is ‘engaged’ with the learning process. A sense of engagement can be found out if say a learning design was required to have discussion within a learning group. The learning analytics may identify that a discussion group dominated by a single student (central red dot),

versus a more equitable distrubution of contributors (blue dots). [Visualisations of interactions taken from the orginal Lockyer paper]

In this sense, the educator has a sense of whether their learning design intentions are being followed or not and adapt appropriately.
Are these more useful ways of classifying learning analytics? I believe that they are, principally because they focus on the core of the ‘learning’ process, or rather they put learning front and centre which seems relevant to the context of ‘learning’ analytics.
Reference:
Lockyer, L., Heathcote, E. & Dawson, S. (2013) Informing Pedagogical Action: Aligning Learning Analytics With Learning Design. American Behavioral Scientist, 57, 1439-1459.
